
Last updated: September 2026 · Reviewed by Miguel Cibeira
This article is for informational purposes only and is not investment advice. See our full Disclaimer for details.
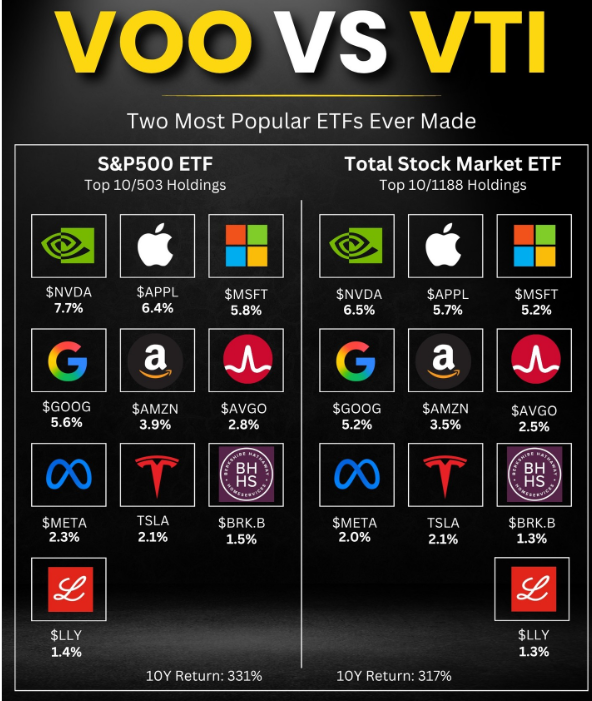
Search “VOO vs VTI” and you’ll find dozens of comparison tables repeating the same handful of claims — some accurate, some technically true but misleading, and a couple that don’t really hold up once you look at the actual numbers. Both funds are run by Vanguard, both charge the same rock-bottom 0.03% fee, and both are often described as “basically the same fund.” That description is mostly right, which is exactly why the myths around the small ways they differ are worth clearing up directly.
Myth: VTI Gives You Meaningfully More Diversification Than VOO
This is the most common claim, and it’s true in a narrow, technical sense that doesn’t hold up in practice. VOO tracks the S&P 500 — roughly 500 large U.S. companies. VTI aims to hold essentially the entire investable U.S. stock market, weighted by market capitalization — thousands of companies, including every name in VOO plus mid-cap, small-cap, and micro-cap stocks on top.
Here’s what the “thousands more companies” framing leaves out: because both funds are market-cap-weighted, and large-cap companies dominate the total value of the U.S. market, roughly 80-85% of VTI’s total weight is made up of the exact same companies that are in VOO. The additional thousands of small and mid-cap stocks only account for the remaining 15-20% of the fund. Historically, the two funds’ returns have been correlated at around 0.99 — about as close to identical as two different funds can get. You’re not choosing between “large companies” and “the whole market” so much as you’re choosing how much of a small/mid-cap sleeve to layer on top of a portfolio that’s already large-cap-dominated either way.
Myth: Since They’re Basically the Same, It Doesn’t Matter Which One You Pick
The opposite myth, and also not quite right. There is one real structural difference between these funds: concentration at the top. Because VOO only holds ~500 stocks, its largest positions make up a bigger share of the total fund — recent data puts VOO’s top 10 holdings at roughly 37-41% of total assets. VTI spreads that same mega-cap exposure across a much larger base of holdings, bringing its top 10 concentration down to roughly 32-36%.
That gap is the actual mechanical reason the two funds occasionally diverge in performance, even though they track almost the same underlying companies. When a handful of mega-cap companies are driving the market higher, VOO tends to capture slightly more of that upside, since those companies make up a larger share of the fund. When market leadership broadens out and smaller companies start outperforming, VTI has more built-in exposure to capture that shift. Neither pattern holds in every market environment, and past patterns don’t guarantee what happens next — but it’s a real difference, not a rounding error.
Myth: VOO Has Been the Better Performer, So It’s the Better Fund
Over the past decade, VOO has posted a slightly higher average annual return than VTI — figures from ETF data providers put VOO’s 10-year average annual return in the neighborhood of 15%, compared to roughly 14.5-14.75% for VTI. That gap is almost entirely explained by the concentration difference above: large-cap, and especially large-cap technology stocks, have been the strongest-performing segment of the U.S. market for most of the past ten years, and VOO simply has more exposure to that segment per dollar invested.
That’s a look backward, not a forecast. Small and mid-cap stocks have led the market during other multi-year stretches in market history, and there’s no reliable way to predict which fund “wins” over your own specific investment horizon. A roughly one-percentage-point historical gap over a decade is also small enough that it can flip depending on the exact time period measured — treating a backward-looking number as a reason to prefer one fund is a weaker argument than it sounds.
Myth: Holding Both Gives You Extra Diversification
Because VOO and VTI are correlated at roughly 0.99, holding both in the same portfolio provides very little additional diversification. You’d effectively be doubling up on the same large-cap core while adding unnecessary complexity — more tickers to track, more rebalancing decisions — without materially changing your risk exposure. If your goal is broader diversification, a more meaningful complement to either fund is something outside U.S. large/total-market equities entirely, such as an international fund or a bond fund, rather than owning both VOO and VTI at once.
Myth: VTI Is Noticeably Riskier Because It Includes Small-Caps
Technically true, practically overstated. VTI’s beta (~1.01) is marginally higher than VOO’s (~0.99), meaning it tends to be slightly more sensitive to overall market moves — this mostly reflects the added volatility that smaller companies typically carry relative to large caps. Depending on the measurement period, small and mid-cap-heavy funds like VTI can see somewhat sharper drawdowns during broad market downturns, since smaller companies are often hit harder in a sell-off. The flip side is that when the market recovers, that same additional exposure has, at times, also participated more strongly in the rebound.
None of this makes one fund meaningfully “safer” than the other in a day-to-day sense — both will fall and rise with the broader U.S. market. The differences show up at the margins, not at the core, and a 0.02-point beta gap is not a reason to pick one fund over the other on risk grounds alone.
What Genuinely Doesn’t Differ Between Them
To be direct about what the myths above get right: the expense ratio (0.03% for both), issuer (Vanguard for both), and dividend yield (~1.2% for both) are essentially identical. Both funds pay dividends quarterly, use Vanguard’s standard tax-efficient ETF share-class structure, and are among the most heavily traded ETFs in the world with tight bid-ask spreads — for the vast majority of long-term investors, trading costs and liquidity are a non-issue for either fund. If you’re investing through a Roth IRA, traditional IRA, or 401(k), the tax-efficiency question matters even less, since those accounts shelter you from annual dividend taxation either way.
| Metric | VOO | VTI |
|---|---|---|
| Index tracked | S&P 500 | CRSP US Total Market Index |
| Number of holdings | ~500 | ~3,500-4,000 |
| Expense ratio | 0.03% | 0.03% |
| Approx. AUM | ~$900B+ | ~$600B+ |
| Top 10 holdings concentration | ~37-41% of assets | ~32-36% of assets |
| Dividend yield | ~1.2% | ~1.2% |
| Beta (vs. total market) | ~0.99 | ~1.01 |
Figures are approximate and sourced from public ETF data providers as of mid-2026. Holdings counts, AUM, and concentration percentages shift regularly — always confirm current numbers on Vanguard’s official fund pages before making a decision.
So Which One Actually Fits Your Situation?
VOO may be a more natural fit if you want direct, simple exposure to the large, established companies most people mean when they talk about “the stock market,” you’re comfortable with a fund that’s somewhat more concentrated in its largest holdings, or you specifically want the S&P 500 as a widely quoted, familiar benchmark.
VTI may be a more natural fit if you want the broadest possible slice of the U.S. stock market in a single fund, you’d rather not make an active bet on large-caps continuing to lead the market, or you like the idea of a true “own the entire market” one-fund approach.
For many long-term, buy-and-hold investors, the honest answer is that either choice is reasonable, and the decision matters far less than simply investing consistently and keeping costs low — which both funds do equally well.
Frequently Asked Questions
Is VOO or VTI better for beginners? Both are widely considered strong “starter” core holdings because of their low costs, broad diversification, and simplicity. Neither requires ongoing stock-picking decisions. The choice between them is a secondary detail compared to the decision to start investing consistently in a low-cost index fund at all.
Can I switch from one to the other later? Yes, though doing so in a taxable brokerage account could trigger a capital gains tax event if the position has grown in value. Selling to switch between two funds that are 99% correlated is rarely worth the tax cost for most investors — inside a tax-advantaged account like an IRA or 401(k), switching has no tax consequence.
Does VTI include international stocks? No. Despite the name “Total Stock Market,” VTI is U.S.-only. For international exposure, investors typically pair a U.S. fund like VOO or VTI with a separate international fund such as VXUS.
Which fund has performed better recently? Recent performance shifts depend on whether large-cap or small/mid-cap stocks have been leading the market in that specific stretch of time. Because this leadership rotates, “which fund performed better” can look different depending on the exact window you measure — check current data before drawing conclusions from any single time period.
Is there a meaningful cost difference between VOO and VTI? No. Both currently charge a 0.03% expense ratio, among the lowest of any ETF on the market. Cost is not a differentiating factor between these two funds.
This article reflects publicly available fund data as of the “last updated” date above and is provided for informational purposes only — it is not a recommendation to buy or sell any security. Expense ratios, holdings, AUM, and performance figures change over time; always verify current data directly on Vanguard’s official fund pages before making an investment decision. Read our full Disclaimer and Privacy Policy for more information.
About the Author
Miguel Ángel Cibeira researches and writes every article on The Fund Atlas personally, sourcing data directly from fund issuers, the IRS, the SEC, and the Federal Reserve. He is not a licensed financial advisor, broker-dealer, or RIA — this site offers independent research and general information, not personalized financial advice. Read the full bio →