
Last updated: July 2026 · Reviewed by Miguel Cibeira
This article is for informational and educational purposes only and is not investment advice. See our full Disclaimer for details.

If you’ve read almost anything else on this site — our VOO vs VTI comparison, our QQQ vs VOO guide, or our Best ETFs to Buy Now roundup — you’ve run into the S&P 500 constantly, usually without much explanation of what it actually is. This article is that explanation: what the index measures, how it’s built, who decides what’s in it, and what it means when a news anchor says “the market was up today” and points to this specific number.
The Short Definition
The S&P 500 is a stock market index that tracks approximately 500 of the largest publicly traded companies listed on U.S. exchanges, weighted by market capitalization — meaning larger companies have a proportionally bigger influence on the index’s overall value than smaller ones. It’s maintained by S&P Dow Jones Indices, and it’s widely treated as the default benchmark for “how is the U.S. large-cap stock market doing” in financial media, retirement plan reporting, and investment research.
Source: S&P Dow Jones Indices, S&P 500 Index official page (index methodology and fact sheet).
A Brief History
The S&P 500 in its modern form launched on March 4, 1957, expanding an earlier, smaller S&P stock index to cover 500 companies for the first time. Its structure looked different than it does today: for decades, the index was organized around fixed industry groupings — 400 industrial companies, 40 utilities, 40 financial companies, and 20 transportation companies — a structure that echoed the sector-based approach still used in the Dow Jones Industrial Average.
That changed on April 6, 1988, when S&P overhauled the index to the market-capitalization-weighted structure it uses today, removing the fixed industry-group quotas and instead letting company size directly determine each stock’s weight in the index. That 1988 shift is part of why comparing “the S&P 500” across many decades requires some care — the index has been recalculated and restructured more than once since 1957, even though the underlying idea (500 large U.S. companies) has stayed consistent.
How the Index Is Actually Built
Selection. Companies aren’t added to the S&P 500 automatically once they hit a certain size. Inclusion is determined by an Index Committee at S&P Dow Jones Indices, which evaluates candidates against a published set of eligibility criteria — covering factors like market capitalization, liquidity, financial viability, and public float — and exercises judgment in choosing which eligible companies actually get added when a seat opens up. This is a meaningful detail: the S&P 500 isn’t a purely mechanical “top 500 by size” list, though size is the dominant factor.
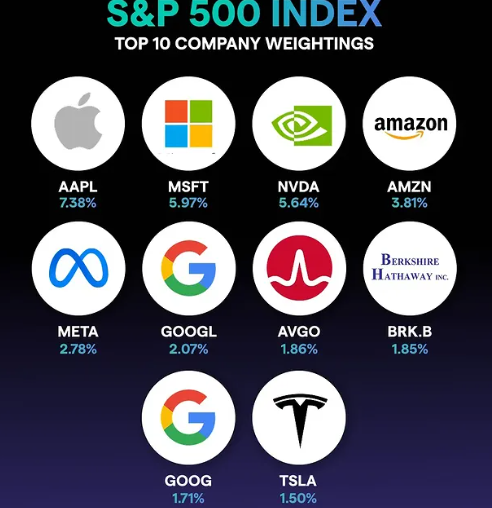
Weighting. Once a company is in the index, its influence on the index’s value is determined by its float-adjusted market capitalization — its share price multiplied by the number of shares actually available for public trading (excluding closely held shares that aren’t realistically tradable). A company twice the size of another, by this measure, has roughly twice the influence on the index’s movement.
Rebalancing. The index’s exact weightings are recalculated quarterly, after the close of business on the third Friday of March, June, September, and December, to reflect current share counts and any capping rules that limit how dominant any single company can become.
What the S&P 500 Actually Covers

As of late 2025 data, the index held a combined float-adjusted market capitalization of roughly $61 trillion, spread across 503 individual listings (some constituent companies have more than one share class counted separately). Despite tracking only about 500 companies out of many thousands of publicly traded U.S. stocks, the index has historically captured somewhere in the range of 70%-80% of total available U.S. stock market capitalization, according to data from the Federal Reserve Bank of St. Louis and S&P Dow Jones Indices — a reflection of how concentrated the U.S. market’s total value is among its largest companies.
Sector Breakdown

The index’s sector composition shifts over time as company valuations change and as the committee adds or removes constituents. Recent sector weightings have shown a composition roughly along these lines:
- Information Technology: ~34%
- Financials: ~13%
- Communication Services: ~10.5%
- Consumer Discretionary: ~10%
- Healthcare: ~10%
- Industrials: ~8%
- Consumer Staples: ~5%
- Energy: ~3%
- Utilities: ~2.4%
- Real Estate: ~1.9%
- Materials: ~1.7%
Sector weightings shift regularly and should be treated as illustrative rather than current — check S&P Dow Jones Indices’ official sector breakdown for up-to-date figures.
This concentration matters practically: an index this heavily weighted toward a single sector (technology) means an investor tracking the S&P 500 is making a larger bet on that sector’s performance than the “500 diversified companies” framing might suggest.
How Has the S&P 500 Performed Historically?
Since 1957, the index has delivered an average annualized total return (with dividends reinvested) in the neighborhood of 10%-10.5%, based on long-run historical return data. That average, however, obscures enormous year-to-year variation — individual calendar years have ranged from gains exceeding 30% to a decline of roughly 37% during 2008. The long-run average is only meaningful to an investor who stays invested through both kinds of years, a theme we cover in more depth in our Best ETFs to Hold Long Term guide.
Is the S&P 500 “The Stock Market”?
Not exactly, even though it’s often used as shorthand for it. A few important distinctions:
It’s large-cap only. The S&P 500 excludes mid-cap and small-cap companies by design — those are tracked separately by other indexes, like the S&P MidCap 400 or the Russell 2000, covered in our Best Small-Cap ETFs guide.
It’s U.S.-only. The index doesn’t include any international companies, which is why investors seeking global diversification typically pair S&P 500 exposure with a separate international fund, a decision we cover in our VTI vs VXUS guide.
It’s not the same as the Dow or the Nasdaq Composite. The Dow Jones Industrial Average tracks just 30 companies using a different (price-weighted) methodology, and the Nasdaq Composite tracks every company listed on the Nasdaq exchange specifically — three different indexes that frequently move in similar directions but aren’t interchangeable.
It’s not the total U.S. stock market. As covered above, the S&P 500 captures roughly 70%-80% of total U.S. market capitalization, not all of it — the remaining share sits in mid-cap and small-cap companies, covered by a fund like VTI but excluded from VOO.
How to Actually Invest in the S&P 500
You can’t buy “the S&P 500” directly — it’s an index, not a security. What you can buy is an ETF or mutual fund designed to track it as closely as possible. This is the entire premise behind funds like VOO, IVV, and SPYM, all covered in more depth in our Best Low-Cost Index ETFs guide, and compared directly against a broader alternative in our VOO vs VTI guide.
Common Misconceptions
“The S&P 500 is the safest way to invest.” It’s broadly diversified across 500 large companies, which reduces single-company risk considerably — but it’s still a stock index that can and does decline significantly, including the roughly 37% single-year decline referenced above.
“A high S&P 500 return means every stock in it went up.” Index-level returns are driven disproportionately by the largest holdings, given the market-cap weighting described earlier. A strong index return can coexist with many smaller constituent companies performing poorly.
“The S&P 500 automatically includes the 500 largest U.S. companies.” As covered above, inclusion involves committee judgment against published eligibility criteria — it’s not a purely mechanical size ranking, even though size is the dominant factor.
Frequently Asked Questions
How often does the S&P 500 change its constituent companies? There’s no fixed schedule for additions and removals — changes happen as needed, driven by mergers, acquisitions, companies no longer meeting eligibility criteria, or the Index Committee identifying new eligible candidates. The index’s weightings are recalculated quarterly, but constituent changes themselves can occur at other times throughout the year.
Who decides which companies are in the S&P 500? An Index Committee made up of S&P Dow Jones Indices staff makes these decisions, evaluating candidate companies against published eligibility criteria covering market capitalization, liquidity, financial viability, and other factors.
What’s the difference between the S&P 500 and an S&P 500 index fund? The S&P 500 itself is an index — a mathematical calculation, not something you can directly buy. An S&P 500 index fund (like VOO) is an actual investable product designed to replicate the index’s performance as closely as possible, typically by holding the same underlying companies in similar proportions.
Does the S&P 500 include dividends in its commonly quoted value? The headline S&P 500 price index level you typically see quoted does not include dividends. A separate “total return” version of the index does include reinvested dividends, and it’s this total-return figure that’s typically used when citing long-run historical average annual returns like the roughly 10% figure referenced above.
Can the S&P 500 go to zero? It’s exceptionally unlikely, given that it holds 500 large, established companies across every major sector simultaneously — for the index to reach zero, all 500 constituent companies would need to become worthless at once. This doesn’t mean the index can’t decline significantly, as it has during past bear markets.
Is the S&P 500 a good long-term investment? This article isn’t making that recommendation directly — but the index’s long-run historical average return and broad diversification are widely cited reasons it’s commonly used as a core long-term holding, a topic covered in more depth in our Best ETFs to Hold Long Term guide. Past performance doesn’t guarantee future results, and any investment decision should reflect your own goals and risk tolerance.
This article reflects publicly available index methodology and historical data as of the “last updated” date above and is provided for general informational and educational purposes only — it is not a recommendation to buy or sell any security. Index composition, sector weightings, and methodology can change; always refer to S&P Dow Jones Indices’ official documentation for current details. Read our full Disclaimer and Privacy Policy for more information.
About the Author
Miguel Ángel Cibeira researches and writes every article on The Fund Atlas personally, sourcing data directly from fund issuers, the IRS, the SEC, and the Federal Reserve. He is not a licensed financial advisor, broker-dealer, or RIA — this site offers independent research and general information, not personalized financial advice. Read the full bio →