
Last updated: July 2026 · Reviewed by Miguel Cibeira
This article is for informational and educational purposes only and is not investment advice. See our full Disclaimer for details.
“Bull market” and “bear market” are two of the most common phrases in financial media, and they’re also two of the most casually misused — thrown around loosely to describe any good or bad stretch for stocks. They actually have specific, commonly agreed definitions, and understanding those definitions (along with what history says about how these periods typically play out) helps put a lot of the anxiety-inducing financial headlines you’ll see into better context.
The Definitions
A bull market is commonly defined as a sustained rise of 20% or more in a broad market index from its most recent low point.
A bear market is commonly defined as a sustained decline of 20% or more in a broad market index from its most recent high point.
Both terms describe broad, sustained trends — not single-day swings or short-lived dips. A single bad week, or even a single bad month, doesn’t constitute a bear market on its own; the 20% threshold, measured from peak to trough (or trough to peak for a bull market), is what separates a genuine bear or bull market from ordinary day-to-day volatility.
Where “Bull” and “Bear” Actually Come From

The terminology dates back further than most people expect — the term “bear” is generally traced to 18th-century London, connected to speculators sometimes called “bearskin jobbers,” who would sell stock (or, more specifically, bearskins) they didn’t yet own, betting they could buy it later at a lower price before delivering it — a bet on a price decline, which is where the association between “bear” and falling markets originated. “Bull” is generally understood as the natural counterpart term, representing the opposite market direction, though its exact origin is less precisely documented than the bear terminology.
Bear Market vs. “Correction”: Not the Same Thing
This is a distinction worth being precise about, since the terms get used inconsistently in casual conversation. A correction refers to a decline of roughly 10%-19.9% from a recent high — a meaningful but more moderate pullback. A decline only becomes an official bear market once it reaches or exceeds the 20% threshold. Corrections happen considerably more often than full bear markets, and most corrections don’t go on to become bear markets at all.
Real Historical Examples
Seeing actual dates and figures makes these definitions more concrete than the percentages alone:
The 2007-2009 financial crisis bear market. Beginning in October 2007 and continuing until March 2009, this bear market saw major U.S. indexes decline by more than 50% from their pre-crisis highs — one of the most severe bear markets in modern market history, driven by the global financial crisis and the ensuing Great Recession.
The 2020 COVID-19 bear market. One of the fastest bear markets on record: the S&P 500 fell roughly 34% in just 33 days in February-March 2020, as the onset of the pandemic triggered a sudden, severe repricing of risk across global markets — followed by a comparably rapid recovery once fiscal and monetary support measures were introduced.
The 2022 bear market. Driven primarily by persistently high inflation and the Federal Reserve’s aggressive interest rate hikes in response, the S&P 500 entered bear market territory in 2022, a decline that also affected bond markets simultaneously — an unusually rare combination, since bonds and stocks don’t typically decline together to that degree, a dynamic covered in our What Are Bonds? guide.
What History Says About Typical Duration and Magnitude
Based on data compiled across multiple decades of U.S. market history, bear and bull markets show a consistent asymmetry:
- Average bear market: roughly 9 to 14 months in duration (estimates vary by data source and measurement period), with an average decline in the range of 30%-36%.
- Average bull market: roughly 2.7 to nearly 5 years in duration (again, estimates vary by source), with an average cumulative gain often well above 100%.
The consistent theme across nearly every long-run historical dataset: bull markets have historically lasted meaningfully longer, and delivered meaningfully larger cumulative gains, than the bear markets that preceded them have taken away. This asymmetry is a large part of the mathematical basis for the long-term, buy-and-hold philosophy covered throughout this site, including our Best ETFs to Hold Long Term guide.
A Bear Market Doesn’t Always Mean a Recession
These two terms are often used almost interchangeably in casual conversation, but they measure different things: a bear market is a stock market classification (a 20%+ price decline), while a recession is an economic classification, generally based on broader indicators like GDP and employment. Based on historical data since 1928, the S&P 500 has experienced considerably more bear markets than the U.S. economy has experienced recessions over the same period — meaning a bear market can occur without an accompanying recession, and stock market declines don’t automatically confirm that the broader economy is contracting.
Why Trying to Time Bear Markets Is Genuinely Difficult
This is one of the more consistently cited, and consistently underappreciated, statistics in long-term investing research: a meaningful share of the stock market’s best individual trading days have historically occurred during bear markets, or in the earliest days of a new bull market — before it was clear from the data available at the time that a new bull market had actually begun. Based on data covering a recent 20-year period, a substantial portion of the market’s strongest days occurred during bear-market conditions, and another meaningful share occurred within the first two months of a new bull market.
The practical implication: an investor who sells during a bear market, intending to wait for things to “calm down” before buying back in, risks missing some of the market’s strongest recovery days — days that are extremely difficult to predict or time in advance, since they often occur while the broader mood still feels distinctly bearish. This is a central piece of the argument, covered throughout this site, for staying invested through downturns rather than attempting to trade around them.
Cyclical vs. Secular Market Trends
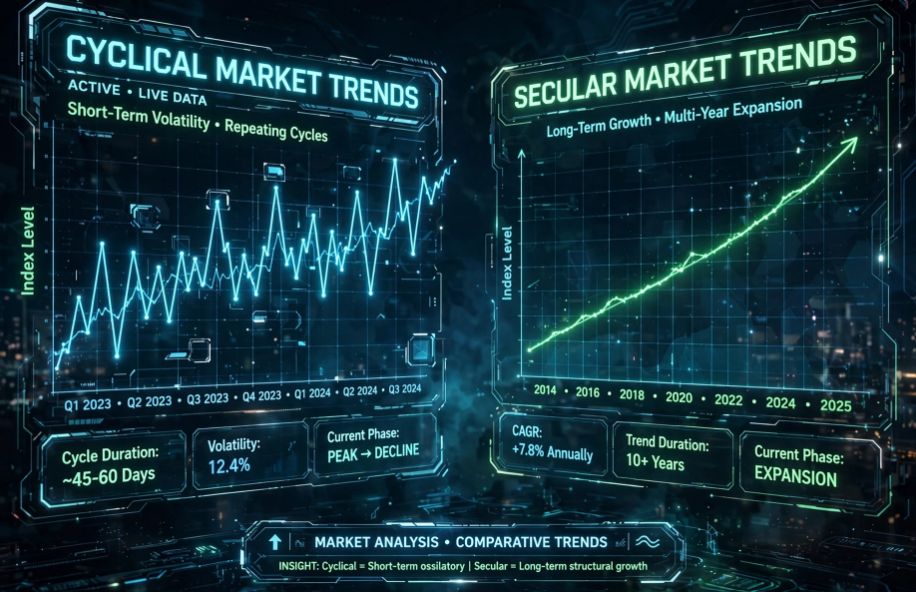
Bear and bull markets are sometimes further described as either cyclical or secular:
Cyclical bull or bear markets are shorter-term trends, typically driven by shifts in investor sentiment, the business cycle, or specific economic events, usually lasting weeks to a couple of years.
Secular bull or bear markets are longer-term trends, often spanning many years or even decades, driven by broader structural forces like long-term interest rate trends, demographic shifts, or major technological change — occasionally continuing through shorter cyclical bear markets nested within a longer secular bull trend, or vice versa.
This distinction helps explain why market commentary can sometimes seem contradictory — a short-term cyclical bear market can occur within a much longer secular bull market, and both descriptions can be simultaneously accurate depending on the time horizon being discussed.
What This Means Practically for Investors
The historical patterns covered in this article connect directly to several other concepts covered throughout this site:
- Sequence-of-returns risk, covered in our Why Young Investors Can Afford More Risk guide, is specifically about when a bear market occurs relative to your withdrawal timeline — the same bear market can affect a young accumulator and a near-retiree very differently.
- Staying invested through downturns, covered in our Best ETFs to Hold Long Term guide, is directly supported by the historical asymmetry between bull and bear market duration and magnitude described above.
- Diversification, covered in our What Is Diversification? guide, doesn’t prevent a broad bear market from affecting a portfolio, but it does reduce exposure to company- and sector-specific risk that can compound a bear market’s damage to a concentrated portfolio.
Frequently Asked Questions
How do I know when a bear market officially starts? By the commonly used definition, a bear market begins once a broad market index has fallen 20% or more from its most recent high. Because this is measured after the fact, based on where the market has actually moved, it’s generally only possible to confirm a bear market has begun once it’s already underway — not to predict its start in advance with confidence.
Is a 20% decline in an individual stock the same as a “bear market”? The term “bear market” is typically used to describe a broad market index (like the S&P 500), though the same 20%-decline concept can be, and sometimes is, applied informally to individual stocks or specific asset classes. This article focuses on the broad-market usage most commonly meant by the term.
Do bear markets always lead to a recession? Not necessarily. Based on historical data, the U.S. stock market has experienced considerably more bear markets than the economy has experienced recessions over the same period, meaning the two don’t move in lockstep, even though they’re often discussed together.
Should I sell my investments when a bear market begins? This article isn’t providing that recommendation — it’s covering the definitions and historical patterns. What the historical data does show is that a meaningful share of the market’s strongest recovery days have occurred during bear markets or in the earliest, least-obvious days of a new bull market, which is part of why many long-term investors and financial professionals generally caution against selling during a downturn based on an attempt to time the recovery.
How long do bear markets typically last? Based on historical U.S. market data, average bear market duration has ranged roughly from 9 months to just over a year, though individual bear markets have varied enormously — from the roughly 33-day COVID-19 crash in 2020 to multi-year bear markets during more severe historical periods like the Great Depression.
What’s the difference between a “correction” and a “bear market”? A correction refers to a decline of roughly 10%-19.9% from a recent high — a meaningful but more moderate pullback. A bear market specifically refers to a decline of 20% or more. Corrections occur more frequently than bear markets, and most corrections do not go on to become full bear markets.
This article is provided for general informational and educational purposes only and is not a recommendation to buy or sell any security. Historical bear and bull market statistics referenced above are compiled from multiple third-party sources covering different time periods and may vary depending on the specific dataset and measurement methodology used. Past performance does not guarantee future results. Read our full Disclaimer and Privacy Policy for more information.
About the Author
Miguel Ángel Cibeira researches and writes every article on The Fund Atlas personally, sourcing data directly from fund issuers, the IRS, the SEC, and the Federal Reserve. He is not a licensed financial advisor, broker-dealer, or RIA — this site offers independent research and general information, not personalized financial advice. Read the full bio →