
Last updated: July 2026 · Reviewed by Miguel Cibeira
This article is for informational and educational purposes only and is not investment advice. See our full Disclaimer for details.
Inflation shows up throughout this site — as part of the argument for why cash isn’t actually “safe” over long periods in our Best ETFs for Beginners guide, as the reason TIPS exist in our Best Bond ETFs guide, and as a recurring theme in our Gold ETFs Explained guide. This article steps back to explain the concept directly: what inflation actually measures, how it’s tracked, and how it affects different types of investments in meaningfully different ways.

The Basic Definition
Inflation is the rate at which the general price level for goods and services rises over time, which corresponds to a decline in the purchasing power of a given amount of money. If inflation runs at 3% annually, something that cost $100 a year ago now costs roughly $103 — meaning the same $100 today buys slightly less than it did a year earlier.
This is distinct from a price increase in any single item — inflation describes a broad, economy-wide rise in prices across a representative basket of goods and services, not the price movement of any one product.
How Inflation Is Measured
In the U.S., the most commonly cited inflation measure is the Consumer Price Index (CPI), published monthly by the Bureau of Labor Statistics, which tracks price changes across a representative basket of goods and services — housing, food, energy, transportation, medical care, and more — collected from thousands of retail establishments and housing units across the country.
Source: U.S. Bureau of Labor Statistics, Consumer Price Index (official CPI data and methodology).
A related measure, the Personal Consumption Expenditures (PCE) price index, is the Federal Reserve’s preferred inflation gauge for policy purposes, using a somewhat different methodology and basket weighting than CPI.
You’ll also frequently see “core” inflation referenced alongside the “headline” figure. Core inflation excludes food and energy prices, which tend to be more volatile month to month due to factors like weather and geopolitical supply disruptions — the idea being that core inflation better reflects underlying, more persistent price trends, while headline inflation captures the full cost-of-living picture consumers actually experience, volatile components included.
The Current Inflation Environment
As of mid-2026, U.S. annual inflation has been moderating from a recent local peak — headline CPI rose 4.2% for the 12 months ending in May 2026, before slowing to roughly 3.5% for the 12 months ending in June 2026, with core CPI (excluding food and energy) running at roughly 2.6%-2.9% over the same stretch. That’s still meaningfully above the Federal Reserve’s long-term target of approximately 2% annual inflation, and the Fed has held its benchmark federal funds rate in a range of roughly 3.50%-3.75% through much of the first half of 2026 as policymakers assess whether inflation is durably returning toward that target.
This context matters because it illustrates something important about inflation generally: it isn’t a fixed, constant number — it fluctuates meaningfully based on economic conditions, supply chain factors, energy prices, and policy decisions, and the specific rate at any given time is always subject to change. Whatever the current reading is by the time you’re reading this, it’s worth checking the latest data from the Bureau of Labor Statistics rather than assuming the figures above remain current indefinitely.
Real Returns vs. Nominal Returns: The Concept That Matters Most
This is the single most important concept connecting inflation to investing, and it’s worth internalizing clearly. Your investment return can be described in two ways:
Nominal return — The percentage gain in dollar terms, without adjusting for inflation. If your portfolio grew from $10,000 to $10,700, that’s a 7% nominal return.
Real return — The percentage gain after subtracting the effect of inflation, reflecting the actual change in your purchasing power. If that same 7% nominal return occurred during a year with 3% inflation, your real return was roughly 4% — the actual increase in what your money can buy, after accounting for the fact that prices rose over the same period.
A positive nominal return doesn’t automatically mean you’re actually better off in real terms. If your investment grows 2% in a year when inflation runs at 4%, your nominal return is positive, but your real return is negative — you technically have more dollars, but those dollars buy less than they did a year earlier. This distinction is central to why “safe,” low-return investments aren’t automatically the lowest-risk choice for a long-term goal, a theme explored further below.
Historical Context: The 1970s as a Cautionary Example
The most commonly cited historical example of sustained, high inflation in the U.S. is the 1970s, when annual inflation repeatedly ran into the double digits, driven by factors including oil price shocks and monetary policy decisions. That period is frequently referenced in inflation discussions because it illustrated how persistently high inflation can erode returns even for investors who felt they were earning reasonable nominal returns, and because it eventually required a prolonged period of aggressive interest rate increases to bring under control — a policy response that itself created significant, if temporary, pain for financial markets and the broader economy. While the specific conditions of any period are unique, the 1970s remains the standard reference point for understanding what a sustained, high-inflation environment can look like in practice.
How Inflation Affects Different Asset Classes
Inflation doesn’t affect every type of investment the same way — understanding these differences is central to how many of the funds covered throughout this site fit into a broader portfolio strategy.
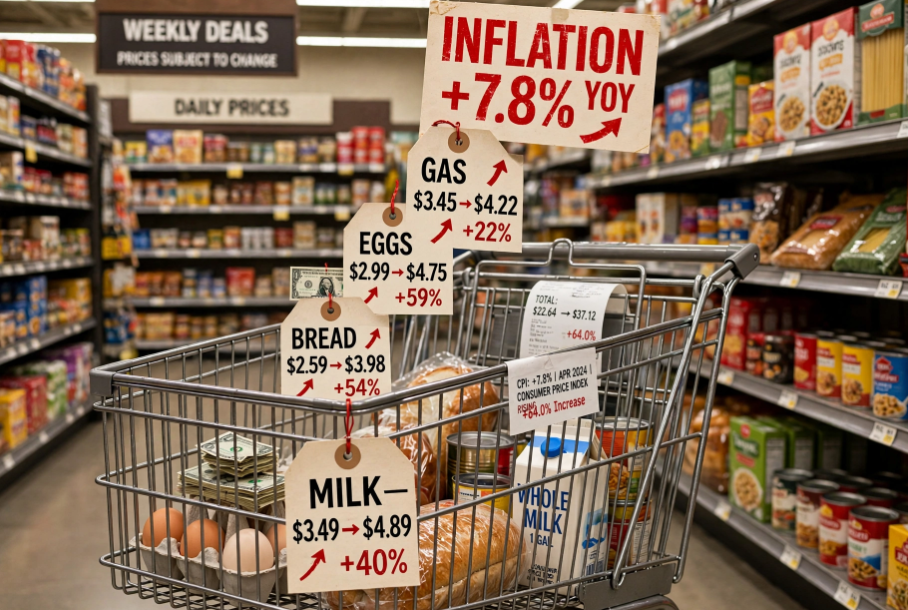
Cash and cash-equivalents. Cash sitting in a low-yield account is directly and continuously eroded by inflation, since it earns little to no return to offset rising prices. This is the most straightforward illustration of inflation risk: holding cash isn’t “safe” from inflation — it guarantees a loss of purchasing power whenever inflation exceeds whatever modest interest the cash is earning.
Bonds. Fixed-rate bonds, covered in our What Are Bonds? guide, are particularly exposed to inflation risk, since their coupon payments are set at issuance and don’t adjust upward if inflation subsequently rises. High inflation also frequently triggers interest rate increases, which — as covered in that same guide — mechanically pushes existing bond prices down, meaning bonds can face pressure from both the direct erosion of their fixed payments’ purchasing power and the price impact of the rate hikes inflation often provokes. Treasury Inflation-Protected Securities (TIPS), covered in our Best Bond ETFs guide, exist specifically to address this gap — their principal value adjusts with CPI, directly linking the investment’s value to the inflation rate rather than leaving it exposed to inflation eroding a fixed payment.
Stocks. The relationship between stocks and inflation is more complicated than a simple hedge or a simple vulnerability. Companies can potentially raise prices to offset their own rising costs, which can help preserve profit margins during moderate inflation — but very high inflation often triggers the kind of aggressive interest rate increases that can pressure stock valuations broadly, as covered in our What Is Market Volatility? guide’s discussion of how rate expectations affect markets. Over long historical periods, stocks have generally delivered returns that outpaced inflation, but this hasn’t held true in every shorter stretch, and certain sectors (utilities, covered in our Best Sector ETFs guide, for example) can be more directly pressured by rising rates than others.
Gold. As covered in our Gold ETFs Explained guide, gold is commonly discussed as a potential inflation hedge, reflecting its historical role as a store of value — though this relationship isn’t perfectly consistent across every inflationary period in history, and gold’s price is influenced by many factors beyond inflation alone, including interest rates and currency movements.
Real estate and REITs. As covered in our Best REIT ETFs guide, real estate is sometimes viewed as a partial inflation hedge, since property values and rental income can rise with broader price levels over time. That said, REITs are also meaningfully sensitive to interest rates, which — as with bonds and stocks — complicates a simple “real estate always protects against inflation” framing, since inflation-driven rate increases can pressure REIT valuations even while underlying rents are rising.
Illustrating Purchasing Power Erosion Over Time
Abstract percentages become more concrete with a specific example attached. At a steady 3% annual inflation rate — roughly in line with the Federal Reserve’s target range plus a modest margin — $100 today would need to grow to approximately $181 after 20 years, and approximately $243 after 30 years, just to maintain the same real purchasing power. Put differently: $100 held in cash today, with no growth at all, would have the real purchasing power of only about $55 after 20 years of 3% inflation, and only about $41 after 30 years.
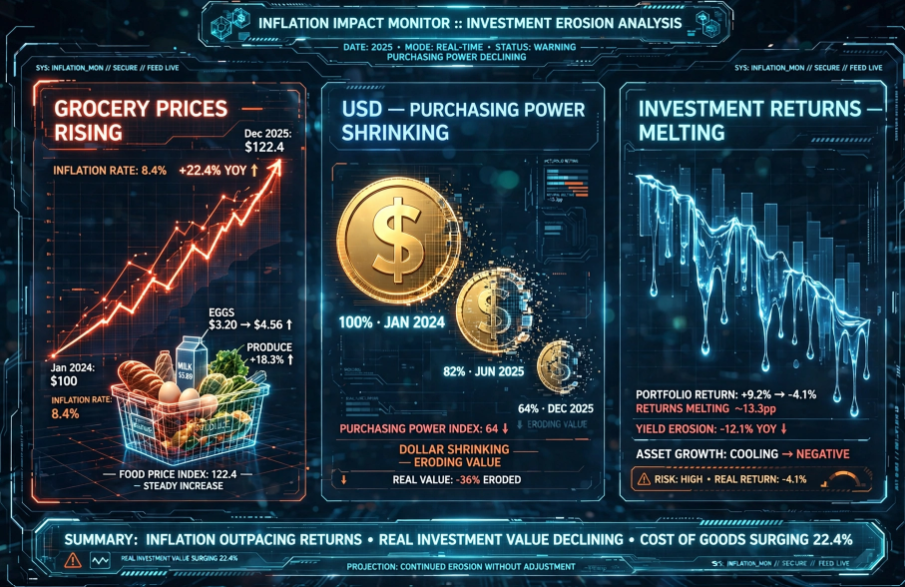
This is precisely the mathematical basis for the argument, made throughout this site (including our Best ETFs for Beginners guide), that holding long-term savings entirely in cash isn’t a “safe,” conservative choice — it’s a strategy that virtually guarantees a real loss of purchasing power over a sufficiently long horizon, even though the nominal dollar amount never technically declines.
Why This Connects to Asset Allocation and Time Horizon
This inflation-erosion dynamic is a major part of why the age-based asset allocation concepts covered in our Why Young Investors Can Afford More Risk guide generally recommend maintaining meaningful equity exposure even for retirees — a portfolio shifted entirely into cash or short-duration instruments to minimize short-term price volatility can inadvertently take on a different, quieter risk: the risk that the portfolio’s real value erodes over a retirement that could last two to three decades, even as its nominal dollar value stays flat or grows only modestly.
The Opposite Problem: Deflation
It’s worth briefly addressing the less commonly discussed flip side of inflation: deflation, a sustained decline in the general price level. While falling prices might sound appealing on the surface, economists generally view persistent deflation as a serious economic problem, not a benefit. Deflation can create a self-reinforcing cycle where consumers and businesses delay spending in anticipation of even lower future prices, which reduces economic activity, which can lead to job losses, which further reduces spending — a dynamic historically associated with severe economic downturns, including extended periods during the Great Depression and Japan’s prolonged deflationary stretch beginning in the 1990s. This is part of why the Federal Reserve targets a modest positive inflation rate rather than 0% or negative inflation — a small buffer against the more damaging risk of deflation taking hold.
How the Market Prices in Future Inflation Expectations
Beyond looking backward at published CPI figures, financial markets also generate a real-time estimate of expected future inflation, derived from the difference between the yield on a standard Treasury bond and the yield on an equivalent-maturity TIPS bond — a figure commonly called the breakeven inflation rate. If a 10-year Treasury bond yields 4.5% and a 10-year TIPS yields 2.0%, the market is implicitly pricing in an average expected inflation rate of roughly 2.5% over that decade — the gap between the two yields.

This is a genuinely useful, continuously updated data point, distinct from the trailing, backward-looking CPI figures discussed throughout most of this article. Breakeven rates reflect what bond market participants are collectively willing to bet on for future inflation, based on real money at stake, rather than a survey of opinions or a single economist’s forecast — though, like any market-based prediction, breakeven rates aren’t guaranteed to be accurate and can shift as new information emerges.
Inflation’s Uneven Impact Across Different Spending Categories
Headline CPI represents an average across a broad basket of goods and services, but inflation rarely affects every category evenly, and this unevenness matters for how people actually experience inflation versus how the statistic reports it. During recent inflationary periods, categories like energy and shelter have at times run considerably hotter than the broader headline figure, while other categories have run cooler or even declined. Research on consumer inflation perception has also found that people tend to weight their sense of “how bad inflation is” more heavily toward frequently purchased items — like groceries or gasoline — than the item’s actual share of a typical household budget would suggest, which is part of why individual perception of inflation can diverge from the official published statistic even when both are technically accurate in their own way.
Frequently Asked Questions
Is some inflation normal, or is all inflation a problem? Some inflation is generally considered normal and even intentional — the Federal Reserve targets a positive inflation rate of roughly 2% annually, rather than 0%, based on the view that modest, predictable inflation supports healthy economic functioning better than persistent deflation (falling prices) would. Inflation becomes more clearly problematic when it runs significantly above that target or becomes unpredictable.
What’s the difference between CPI and “the inflation rate”? CPI (Consumer Price Index) is the specific, most commonly cited data series used to calculate “the inflation rate” in everyday conversation — when you hear that “inflation is 3.5%,” that figure is typically the year-over-year percentage change in CPI. Other measures, like the PCE price index, calculate a similar concept using a somewhat different methodology and can show a modestly different figure for the same period.
Does inflation always mean interest rates will rise? Not automatically, but there’s a strong historical relationship — central banks, including the Federal Reserve, frequently respond to elevated inflation by raising interest rates, since higher borrowing costs tend to cool economic activity and, over time, help bring inflation back toward target. This relationship is a policy choice and response pattern, not an automatic mathematical law, and the specific response can vary based on broader economic conditions.
Which investments are the best inflation hedge? There’s no single perfect inflation hedge — TIPS are specifically designed to track CPI directly, gold and real estate are commonly discussed as partial hedges with imperfect historical consistency, and broad stock exposure has historically outpaced inflation over long periods despite more mixed short-term behavior. Most mainstream guidance suggests a diversified combination of these approaches, covered throughout this site’s fund-specific guides, rather than relying on any single asset as a complete inflation solution.
Why is holding too much cash considered risky if cash doesn’t lose nominal value? Because inflation erodes cash’s real purchasing power continuously, even though the nominal dollar amount never technically decreases. As illustrated in the numerical example above, cash held for decades without meaningful growth can lose a substantial share of its real value, even while the account statement shows the same (or a very slightly higher) dollar figure the entire time.
How can I check the most current inflation rate? The Bureau of Labor Statistics publishes updated CPI data monthly, typically in the middle of the following month, available directly at bls.gov/cpi. Given how much inflation figures can shift over relatively short periods, it’s worth checking current data directly rather than relying on any specific number cited in an article like this one for time-sensitive decisions.
This article is provided for general informational and educational purposes only and is not a recommendation to buy or sell any security. Inflation and interest rate figures referenced above reflect data available as of the “last updated” date and change regularly; always verify current figures directly with the Bureau of Labor Statistics (bls.gov) and the Federal Reserve before making decisions based on inflation data. Read our full Disclaimer and Privacy Policy for more information.
About the Author
Miguel Ángel Cibeira researches and writes every article on The Fund Atlas personally, sourcing data directly from fund issuers, the IRS, the SEC, and the Federal Reserve. He is not a licensed financial advisor, broker-dealer, or RIA — this site offers independent research and general information, not personalized financial advice. Read the full bio →