
Last updated: September 2026 · Reviewed by Miguel Cibeira
This article is for informational and educational purposes only and is not investment advice. See our full Disclaimer for details.
“Volatility” is a word that shows up constantly across this site — in our Best Growth ETFs guide, our Best Small-Cap ETFs guide, our coverage of crypto and leveraged funds — almost always as a warning. But most of what gets said about volatility in everyday investing conversation is a little bit wrong, or at least incomplete. Here are five of the most common misconceptions, and what the actual math and data show instead.
Myth 1: Volatility Just Means the Price Is Going Down
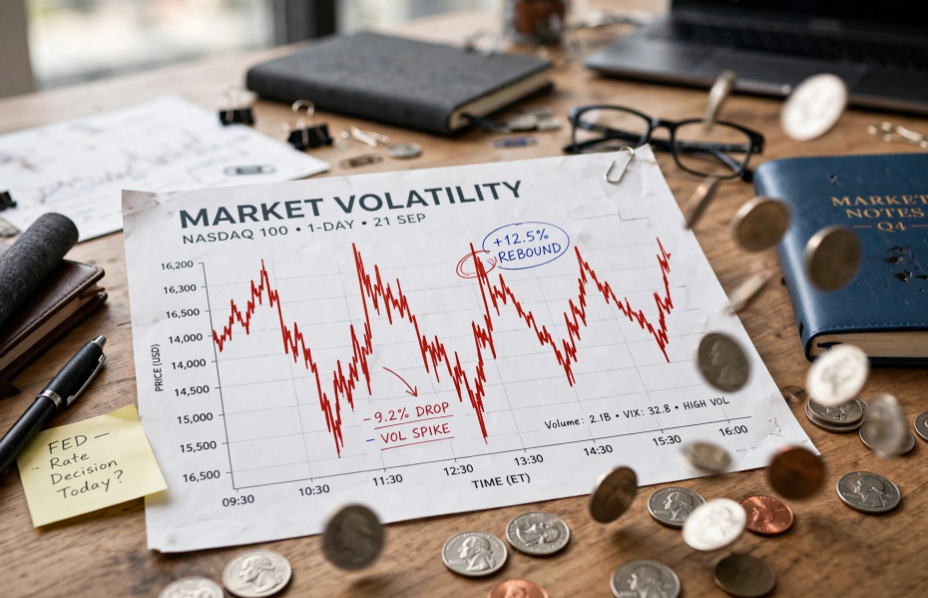
Everyday language uses “volatile” almost exclusively to describe scary downward swings. The actual statistical concept doesn’t work that way. Volatility measures how much, and how quickly, an investment’s price moves — in either direction — over a given period. A stock that surges 15% in a week is exhibiting exactly as much “volatility,” in the statistical sense, as one that drops 15% in a week. The term describes the magnitude of price movement, not whether that movement is good or bad news for you.
This matters because it reframes what you’re actually being warned about when an article calls a fund “volatile.” It isn’t necessarily saying the fund tends to lose money — it’s saying the fund’s price tends to move by a lot, whichever direction it happens to be heading.
Myth 2: A Fund’s Beta or Standard Deviation Is a Fixed, Permanent Number
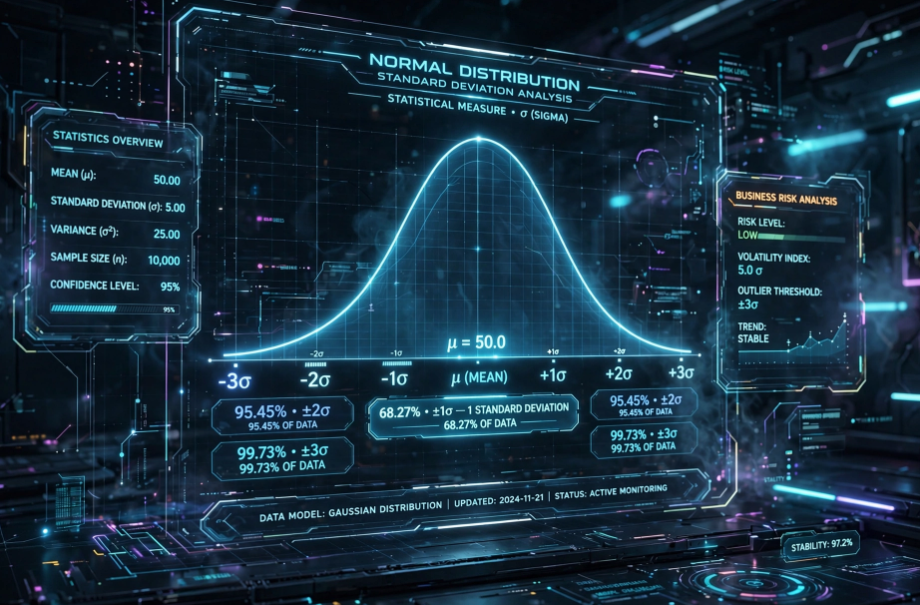
The most common way to quantify volatility is standard deviation — a statistical measure of how far a set of values (an investment’s periodic returns) typically deviates from its own average. A related but distinct measure, beta, measures how much an investment’s price has historically moved relative to a benchmark, typically the S&P 500. Our QQQ vs VOO guide notes that QQQ’s beta and five-year standard deviation have both run considerably higher than VOO’s, a concrete illustration of the concentrated growth fund’s larger swings.
How to read a beta value:
- Beta of 1.0 — The investment has historically moved roughly in line with the benchmark.
- Beta greater than 1.0 — The investment has historically amplified the benchmark’s moves in both directions. A beta of 1.5 suggests roughly 1.5 times the benchmark’s move, in either direction.
- Beta less than 1.0 (but above 0) — The investment has historically dampened the benchmark’s moves.
- Beta near 0 — The investment’s price movements have shown little historical relationship to the benchmark’s at all.
- Negative beta — Rare, but describes an investment that has historically tended to move opposite the benchmark.
A quick illustration: suppose a fund has a calculated beta of 1.4. On a day the S&P 500 rises 2%, that fund would be expected to rise roughly 2.8% (2% × 1.4). On a day the S&P 500 falls 2%, that same fund would be expected to fall roughly 2.8% as well — beta amplifies moves in both directions equally, it doesn’t selectively amplify gains while dampening losses. A higher beta is not inherently “better” or “worse”; it just means larger swings in whichever direction the benchmark happens to move.
Here’s the myth: treating either figure as a fixed, permanent trait of a fund. Both are calculated from a specific historical measurement period, and both can shift meaningfully over different windows — particularly for funds tied to fast-changing sectors. A fund’s beta calculated over the past year can differ meaningfully from its beta calculated over the past five years. Beta and standard deviation are useful reference points, not fixed characteristics stamped permanently onto an investment.
Myth 3: Higher Volatility Always Means Higher Risk

This is a genuinely debated question in investing theory, not a settled one. Standard deviation, beta, and similar measures are the most commonly used quantitative tools for assessing an investment’s risk, largely because they’re objectively measurable and comparable — which is why this site references them throughout its fund comparisons. But some investors and academics argue that volatility (short-term price fluctuation) isn’t the same as the risk that actually matters most to a long-term investor: the risk of a permanent loss of capital. By this view, a stock that fluctuates significantly but is eventually sold for a profit after a long holding period wasn’t genuinely “risky” for that holder, even though it showed high volatility along the way.
Both perspectives have merit. Volatility genuinely does matter practically, even for a long-term investor, because it affects your ability to psychologically tolerate holding an investment through a sharp decline without panic-selling, a theme covered in our Best ETFs to Hold Long Term guide. In that sense, volatility is a real, practical risk factor — not because the math says so, but because human behavior under stress makes it one.
A numerical example makes this more concrete. Imagine two hypothetical funds, both averaging the same 8% annual return over a five-year stretch. Fund A’s annual returns: 7%, 9%, 6%, 10%, 8% — a tight cluster around the average. Fund B’s annual returns: -12%, 25%, -5%, 30%, 2% — also averaging 8%, but with dramatically larger swings, including two negative years. An investor comparing these two funds purely on “average annual return” would see them as identical, but Fund B’s standard deviation is considerably higher — and its actual compounded ending balance is lower than the simple average would suggest, since a loss requires a proportionally larger subsequent gain just to recover the original balance (a point covered further in our What Is Compound Interest? guide). This is exactly why volatility is reported alongside return figures throughout this site, rather than return being presented as a standalone number.
Two other measures worth knowing, both referenced throughout this site: maximum drawdown measures the largest peak-to-trough decline an investment has experienced — a more intuitive “how bad did the worst stretch actually feel” measure than standard deviation alone (see our VOO vs VTI and SCHD vs VYM guides). Sharpe ratio, referenced in our JEPI vs SCHD comparison, measures how much return an investment generated relative to the volatility it took on to generate it — whether the extra risk was actually compensated, rather than comparing raw returns in isolation.
Myth 4: The VIX Tells You How Much the Market Has Already Moved
You’ll frequently see financial media reference “the VIX” during periods of market stress. Formally the Cboe Volatility Index, the VIX measures the market’s expectation of future volatility in the S&P 500 over the next 30 days, calculated from the prices of S&P 500 index options. Unlike standard deviation and beta, which look backward at historical price movements, the VIX is inherently forward-looking — it reflects what options traders are currently pricing in for expected volatility, based on how much they’re willing to pay for options that would profit from or protect against large price swings.
There’s no single official threshold, but commonly cited guidelines suggest VIX readings below roughly 20 generally reflect a calmer market, readings in the 20-30 range reflect a more elevated, uncertain environment, and readings above 30 — with occasional extreme spikes well beyond that during acute crises — reflect a market pricing in significant near-term turbulence. The VIX has historically spiked to extreme levels during major stress events, including the 2008 financial crisis and the initial COVID-19 shock in early 2020, both covered in our What Is a Bull Market vs. a Bear Market? guide, before subsiding as conditions stabilized.
This forward/backward distinction is worth stating as its own concept. Historical volatility describes how much a price has actually moved in the past. Implied volatility describes how much the market currently expects it to move in the future, derived from options prices rather than past behavior. The two can diverge: an investment can show low historical volatility while currently carrying high implied volatility, if the market is anticipating an unusual near-term event — an earnings announcement, a regulatory decision — that hasn’t happened yet but is expected to move the price once it does. That’s part of why the VIX can spike before an anticipated event actually occurs.
Myth 5: If You Can’t Stomach Volatility, Your Only Option Is to Avoid It
Volatility isn’t randomly distributed across investment types. Broad, diversified index funds (VOO, VTI) generally show lower volatility than concentrated alternatives, since gains and losses across hundreds or thousands of companies partially offset each other — a direct application of the concept covered in our diversification guide. Concentrated growth and sector funds (QQQ, XLK) generally show higher volatility, as covered in our Best Growth ETFs and Best Sector ETFs guides. Bonds, particularly shorter-duration ones, generally show meaningfully lower volatility than stocks, as covered in our What Are Bonds? guide. Cryptocurrency and leveraged funds generally show the highest volatility of any category covered on this site.
Given that spread, avoiding volatility entirely isn’t the only lever available — and for most long-term goals, it isn’t even the most useful one. As covered in our Why Young Investors Can Afford More Risk guide, a long investing horizon provides time to recover from a volatile stretch before the money is actually needed. Rather than avoiding volatile asset classes altogether, many investors manage overall portfolio volatility by blending higher-volatility growth assets with lower-volatility holdings like bonds — the core logic behind the glide-path strategies covered in our Best ETF Portfolio for Retirement guide. Volatility can even work in your favor with a consistent investing approach: regularly investing a fixed amount over time means your fixed contribution buys more shares during lower-price periods and fewer during higher-price ones, without requiring any prediction of when prices will move.
Ultimately, your own psychological tolerance matters as much as the math. An investment’s volatility only becomes a genuine problem if it causes you to make a poor decision — like selling during a decline — that you wouldn’t have made with a calmer investment. Understanding your realistic tolerance for price swings, not just the abstract statistics, is a meaningful part of choosing an appropriate asset allocation.
Frequently Asked Questions
What’s considered a “high” beta? There’s no single official threshold, but a beta above roughly 1.2-1.5 is often considered notably higher than the broad market, while a beta below roughly 0.5-0.8 is often considered notably lower. Context matters — a beta of 1.3 might be unremarkable for a growth-focused sector fund but would be considered high for a fund marketed as conservative.
Does a low-volatility investment guarantee a safer outcome? Not entirely — low historical volatility reduces short-term price uncertainty but doesn’t eliminate other risks, such as a slower-growing investment failing to keep pace with inflation over a long holding period, a theme covered in our Best ETFs for Beginners guide. Low volatility and low overall risk aren’t perfectly synonymous.
Why does the VIX spike so dramatically during market crashes? The VIX reflects the price investors are willing to pay for options that would protect against or profit from large price swings. During a crash, demand for that protection increases sharply, options prices rise correspondingly, and the VIX — calculated directly from those prices — spikes as a result.
Is volatility always a bad thing for investors? Not necessarily. Volatility creates the price fluctuations that dollar-cost averaging can take advantage of, and some investors and academics argue that short-term volatility matters less than the risk of permanent capital loss for a sufficiently long-term, patient holder. Volatility becomes most clearly problematic when it causes an investor to make a poor emotional decision, like selling during a downturn.
How is standard deviation different from beta? Standard deviation measures an investment’s volatility in isolation — how much its own returns vary around its own average. Beta measures an investment’s volatility relative to a specific benchmark, like the S&P 500. An investment can have high standard deviation while having a beta close to 1.0, if its volatility closely tracks the broader market’s volatility rather than moving independently of it.
This article is provided for general informational and educational purposes only and is not a recommendation to buy or sell any security. Volatility, beta, and VIX figures referenced throughout this site are historical or point-in-time measures sourced from public data providers and are not predictive of future price behavior. Read our full Disclaimer and Privacy Policy for more information.
About the Author
Miguel Ángel Cibeira researches and writes every article on The Fund Atlas personally, sourcing data directly from fund issuers, the IRS, the SEC, and the Federal Reserve. He is not a licensed financial advisor, broker-dealer, or RIA — this site offers independent research and general information, not personalized financial advice. Read the full bio →